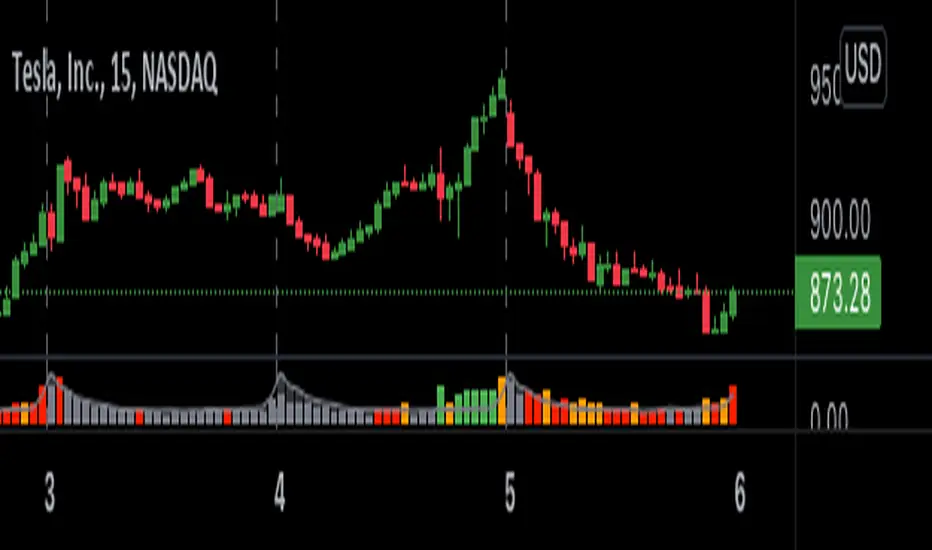
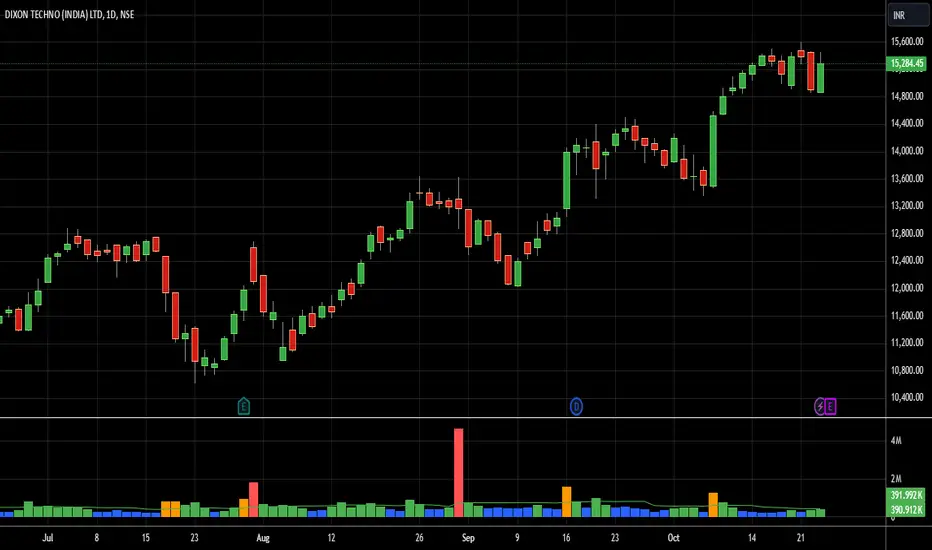
Colored Volumes HistogramThis colored volumes histogram uses standard deviation from the mean to color bars.
I prefer use large Length input for more stability at mean and standard deviation values.
Uses 5 colors, by default:
Red = Volume >= 4 stdev;
Orange = 4 stdev > Volume >= 2.5 stdev;
Yellow = 2.5 stdev > Volume >= 1 stdev;
White = 1 stdev > Volume >= -0.5 stdev;
Aqua = -0.5 stdev > Volume.
I coded another script, called "Volumes on Candles". It uses the same idea, but color directly the candle.
ค้นหาในสคริปต์สำหรับ "COLORED VOLUME"
Color Volume Bars V 0.1Preliminary version.
Color Volume Bars will indicate the volume % related to the historical average by painting the bars on the graph. Nice to identify when a large amount of deals are closed at a certain price level.

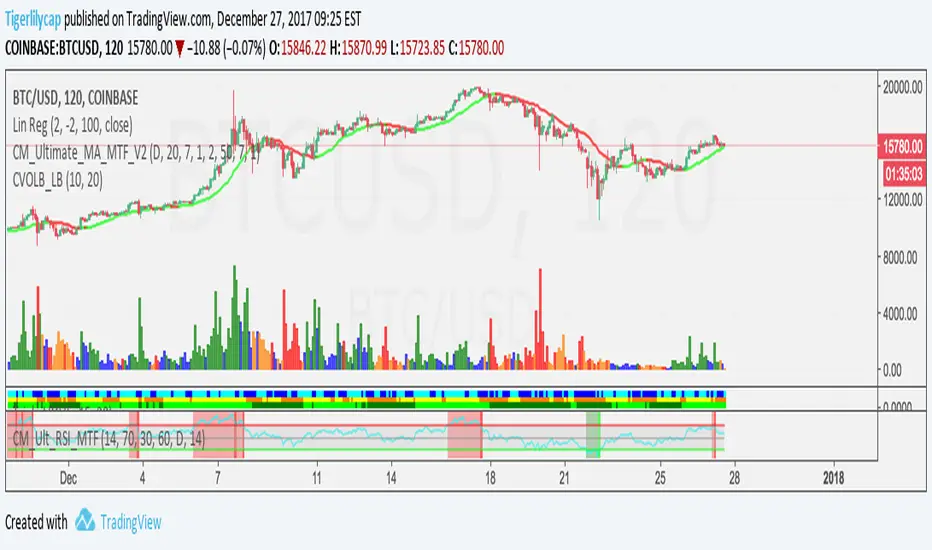
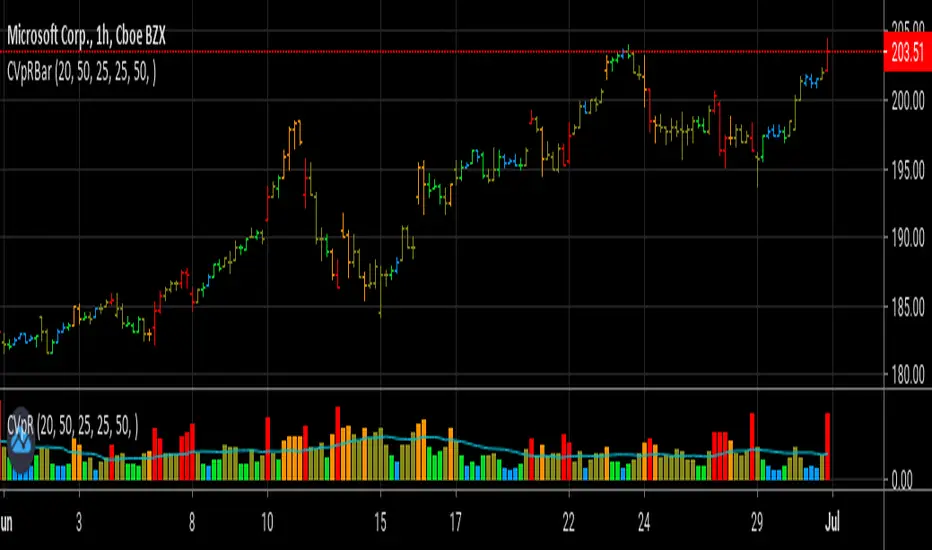
Colored Volume Bars with Standard Deviation from the MeanI have updated the indicator to help visualize volume . The percentage scale is based on a 21 period look back average . The colored volume bars represent volumes that exceed specified standard deviation of this 21 period average as indicated in the figure. The deviation bands are based on a the 55sma of the 21 period average (brown line). A 8 period sma of the 21 moving average (red line) is also indicated.

Colored Volume Bars [LazyBear] with overlayDivs and candle alignment a little easier to see - volume/2 to size correctly - could still use some refining
All credits to LazyBear for his color volume bar source code
Colored Volume Bars [LazyBear]Edgar Kraut proposed this simple colored volume bars strategy for swing trading.
This is how the colors are determined:
- If today’s closing price and volume are greater than 'n' days ago, color today’s volume bar green.
- If today’s closing price is greater than 'n' days ago but volume is not, color today’s volume bar blue.
- Similarly, if today’s closing price and volume is less than 'n' days ago, color today’s volume bar orange.
- If today’s closing price is less than 'n' days ago but volume is not, color today’s volume bar red.
Buy the green or blue volume bars, use a 1% trailing stop, and stand aside on red or orange bars.
As you see, this is more for entry confirmation. I have not tested this on any instrument.
You may have to tune the lookback period for your instrument. Default is 10.
More info:
"A color-based system for short-term trading" - www.traders.com
List of all my indicators:

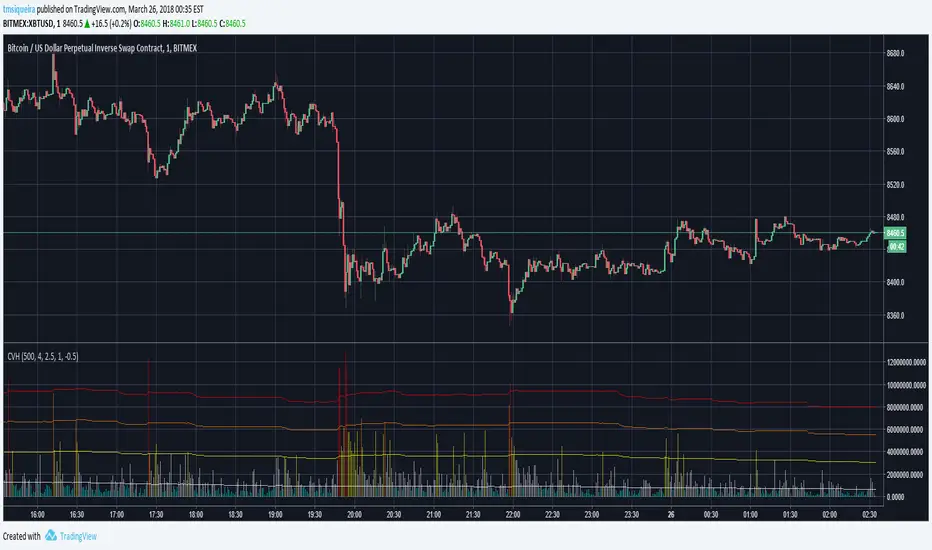
Colored Volume Bars standard deviation from meanThe colour bars:
Green: Price up - Volume > 2 x STD of last 21 bars
Blue: Price up - Volume > 1 x STD of last 21 bars
Maroon: Price down - Volume > 2 x STD of last 21 bars
Purple: Price down - Volume > 1 x STD of last 21 bars
Grey: not high volume bar
Green line: 2 bar sma
Red line: 8 period sma of the greenline
Bollinger band: 55 period sma of the 21 period sma with bands 1.618 deviation from the mean

Color Volume Bars V 0.1 - Paints bars accrding to its volume.Preliminary version of volume % compared exclusively to series (volume) average painted on each bar, according to adjustable parameters.

Colored VolumeThe height represents total volume, the ratio of red to green represents the bullish/bearish volume. AKA buyers or sellers.

Colored Volume Bars standard deviation from meanThe colour bars:
Green: Price up - Volume > 2 x STD of last 21 bars
Blue: Price up - Volume > 1 x STD of last 21 bars
Maroon: Price down - Volume > 2 x STD of last 21 bars
Purple: Price down - Volume > 1 x STD of last 21 bars
Grey: not high volume bar
Green line: 2 bar sma
Red line: 8 period sma of the greenline
Bollinger band: 55 period sma of the 21 period sma with bands 1.618 deviation from the mean

Colored Volume Bars All Markets: Combining Volume SourcesUsing volume in Forex is potentially misleading as we are only provided the broker volume or futures exchange volume for the currency or commodity in a decentralised market. This code combines the volumes from FXCM, Onanda and futures for the instrument being studied. The combination of the volumes could improve the reliability of the volume being considered. Using this approach other volume indicators can also be improved.


Colored Volume Weighted Average PriceSimple addition to the standard VWAP indicator.
If price is above VWAP the plot is colored green. If below plot is colored red.
Colors are configurable.
You can also choose the source for price (i.e. open/low/high etc)

SVA - Simple Volume Analyzer, by BlueJayBird [bjb] ENGLISH & SPANISH
------------------------------------- ENSLIGH
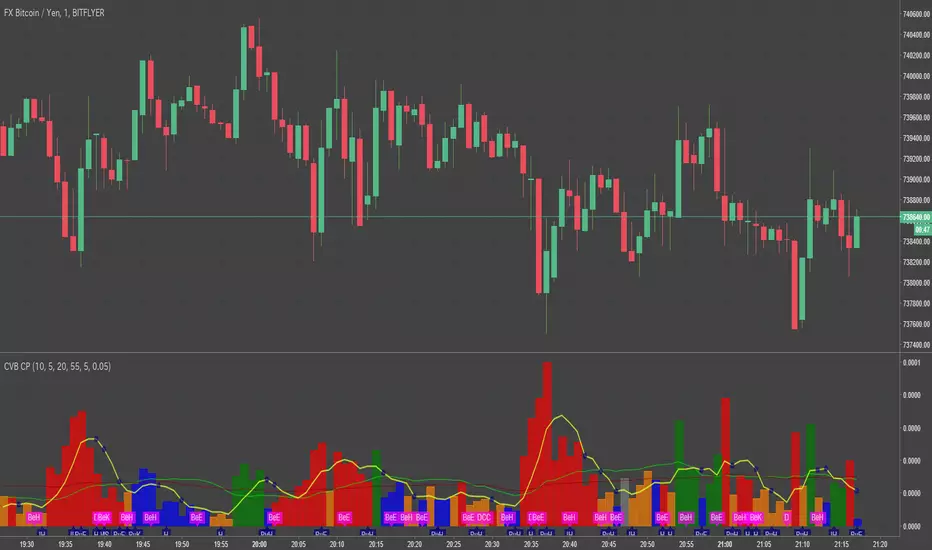
The idea was initially inspired in the concepts shared by @LazyBear on his indicator "Better Volume Indicator" (). But I found it somewhat complicated and dull. So I came up with this.
Concept:
It changes the color of volume bars based on surrounding volume changes.
Volume changes are plotted as volume MAs lines in the volume pane.
Whenever the volume is higher than these MAs, the bar changes color.
For this reason, the bar color change is RELATIVE TO the surroundings, because the color change depends on how far the MA has been extended due to sudden (or not) changes in the volume.
BAR COLORS:
Weak Green and Red: Low volume. The calm before or after the storm.
Normal Green and Red: Mid volume. Still low volume, you may get bored.
Yellow: High volume. Players are playing hard and harder.
White: Ultra-High Volume. The elephants stepped in.
NOTES:
SVA works better at lower timeframes. Though as far as I can tell, it works pretty well as far as 1D timeframe.
------------------------------------- SPANISH
La idea estuvo inicialmente inspirada en los conceptos expuestos por @LazyBear en su indicador "Better Volume Indicator" (). Pero lo encontré un poco complicado y falto de claridad. Así que me inventé este.
Conceptp:
Cambia el color de las barras basándose en los últimos cambios de volumen.
Los cambios de volumen son ploteados como lineas de medias móviles (MAs, es decir "Moving Averages") en la sección del volumen (chart pane).
En cualquier momento que el volumen es mayor que estos MAs, el color de las barras cambia.
Por esta razon, el cambio de color de las barras es RELATIVO a lo que está sucediendo alrededor, ya que el cambio de color depende de qué tan lejos el MA se haya extendido por causa de los últimos cambios (o no) de volumen.
BAR COLORS:
Verde y rojo apagados: Volumen bajo (Low Volume). La calma antes de la tormenta.
Verde y rojo normales: Volumen medio (Mid volume). Volumen todavía bajo. Es posible que te aburras.
Amarillo: Volumen alto (High Volume). Los jugadores están jugando duro.
Blanco: Volumen ultra-alto (Ultra-High Volume). Los elefantes entran a la cancha.
NOTAS:
SVA funciona mejor en temporalidades menores. Pero por lo que he visto, funciona bien hasta la temporalidad de 1D.

Volume Insignts AnalyzerDescription:
The Volume Insight Analyzer is an advanced Pine Script designed for traders who want a comprehensive view of volume dynamics on their charts. This script combines multiple volume-based indicators to help identify key trading opportunities, including significant volume days, volume dry-ups, and pocket pivots.
Key Features:
VDU (Volume Dry-Up) Detection: Automatically identifies and marks days when the volume is significantly below its moving average, helping to spot potential breakout or breakdown points. Customizable volume thresholds allow for tailored analysis based on your trading strategy. The Volume Dry-Up label appears when the volume is substantially below its average level and the price is near a key moving average. This condition indicates a period of equilibrium between supply and demand, suggesting a potential low-risk entry point for traders.
Pocket Pivot Analysis using 5 and 10 Length Pocket Pivots: Highlights days with exceptionally high volume compared to recent history, indicating potential pocket pivots. Visual markers on the chart and volume bars color-coded for 5 and 10-day lengths. Pocket pivot points are identified when the volume on a given day exceeds the maximum volume observed over the past several days. Specifically, a 5-day pocket pivot point is marked when today's volume surpasses the highest selling volume of the last 5 days. A cluster of 5-day pocket pivot points within a base is a strong indicator of stock strength. Similarly, a 10-day pocket pivot point following a Volume Dry-Up (VDU) suggests a potential entry opportunity. Moreover, a pre-existing cluster of 5-day pocket pivot points before a 10-day pocket pivot point provides greater conviction in the trade.
Volume Moving Averages: Set different lengths for primary and secondary moving averages to track volume trends over daily, weekly, and monthly timeframes. Options to display moving average lines on the volume chart.
Volume Visualization:
a. Major and Minor Volume Bars: Option to display bars that are either above or below average volume levels. Adjustable settings to show or hide these bars based on user preference.
b. Volume Bar Coloring: Volume bars are color-coded based on significant volume thresholds, including green for bullish signals, red for bearish signals, and orange for volume dry-ups.
Volume Metrics Table: A customizable table that displays real-time volume metrics including Relative Volume (RVOL), Turnover, and the number of high volume days. The table can be oriented horizontally or vertically and styled according to your theme preferences.
Visual Indicators:
a) Volume Dry-Up (VDU) Labels: Clearly marked VDU events with textual annotations on the chart.
b) Bullish and Bearish Arrows: Arrows indicating potential bullish or bearish closes based on volume analysis, enhancing decision-making.
Customization Options:
a) Dark and Light Theme Support: Toggle between dark and light themes to match your chart settings.
b) Adjustable Parameters: Easily configure input settings such as volume thresholds, MA lengths, and table display options to fit your trading style.
How to Use:
Set Parameters: Adjust the script settings such as volume thresholds, moving average lengths, and display preferences according to your analysis needs.
Analyze Volume Patterns: Use the indicators and visual markers provided by the script to identify significant volume patterns and potential trading signals.
Monitor Metrics: Refer to the volume metrics table for a quick overview of key volume-related statistics and trends.
Make Informed Decisions: Utilize the visual cues and volume data provided by the script to enhance your trading strategy and make more informed decisions.
Disclaimer:
This script is for informational purposes only and should not be considered as trading advice. Use it in conjunction with other analysis tools and consult with a financial advisor if needed. Trading involves risk, and past performance does not guarantee future results.

Volume Pro Indicator## Volume Pro Indicator
A powerful volume indicator that visualizes volume distribution across different price levels. This tool helps you easily identify where trading activity concentrates within the price range.
### Key Features:
- **Volume visualization by price levels**: Green (lower zone), Magenta (middle zone), Cyan (upper zone)
- **VPOC (Volume Point of Control)**: Shows the price level with the highest volume concentration
- **High and Low lines**: Highlights the extreme levels of the analyzed price range
- **Customizable historical analysis**: Configurable number of days for calculation
### How to use it:
- Colored volumes show where trading activity concentrates within the price range
- The VPOC helps identify the most significant price levels
- Different colors allow you to quickly visualize volume distribution in different price areas
Customizable with numerous options, including analysis period, calculation resolution, colors, and visibility of different components.
### Note:
This indicator works best on higher timeframes (1H, 4H, 1D) and liquid markets. It's a visual analysis tool that enhances your understanding of market structure.
#volume #vpoc #distribution #volumeprofile #trading #analysis #indicator #professional #pricelevels #volumedistribution

Bharat Jhunjhunwala v2- Volume Color CodingPurpose of the Script
This script is designed for traders in India to visualize and analyze trading volume in the stock market. It colors the volume bars based on how the current trading volume compares to its average over the past 20 periods. This helps traders quickly identify unusual trading activity.
How It Works Step by Step
Setting Up the Indicator
Name & Display: The script is named "Bharat Jhunjhunwala- Volume Color Coding" and it displays below the main stock chart (overlay=false).
Volume Format: It formats the data specifically for volume (format=format.volume).
User Input
Volume Moving Average Period: Users can set how many periods (e.g., days) to consider for calculating the average volume. By default, it's set to 20 periods, and users can adjust this if needed.
Predefined Volume Ratios
The script uses fixed ratios to categorize the current volume:
Ultra High Volume: 3.0 times the average volume.
High Volume: 1.8 times the average volume.
Ultra Low Volume: Between 0.4 and 0.7 times the average volume.
Note: These ratios are hardcoded, meaning users cannot change them.
Calculating the Average Volume
The script calculates the Simple Moving Average (SMA) of the volume over the specified number of periods (default is 20). This average helps determine what "normal" volume looks like.
Determining Volume Levels
Ultra High Volume: If the current volume is 3 times or more the average, it's flagged as ultra high.
High Volume: If the current volume is 1.8 times or more but less than ultra high, it's flagged as high.
Ultra Low Volume: If the current volume is between 0.4 and 0.7 times the average, it's flagged as ultra low.
Normal Volume: Any volume that doesn't fit the above categories is considered normal.
Color Coding the Volume Bars
Based on the volume level determined:
Red: Ultra High Volume
Orange: High Volume
Blue: Ultra Low Volume
Green: Normal Volume
This color coding makes it easy to spot unusual trading activity at a glance.
Plotting on the Chart
Volume Bars: The script plots the actual trading volume as colored bars according to the categories above.
Volume Moving Average Line: It also plots the 20-period moving average of the volume as a green line. This line serves as a reference to compare current volumes against the average.
Why This is Useful
Quick Identification: Traders can instantly see when there's unusually high or low trading activity, which might indicate significant market moves or investor interest.
Trend Analysis: By comparing current volume to the moving average, traders can assess whether the current market behavior is stronger or weaker than usual.
Decision Making: Colored volume bars can help in making informed trading decisions, such as entering or exiting positions based on volume spikes or drops.
Customization
Adjusting the Moving Average: While the volume ratios are fixed, traders can change the number of periods used to calculate the moving average to better fit different trading strategies or time frames.
Summary
This script enhances the standard volume indicator by adding color-coded signals based on predefined volume thresholds relative to a moving average. It's a helpful tool for Indian stock traders to monitor and react to changes in trading volume effectively.
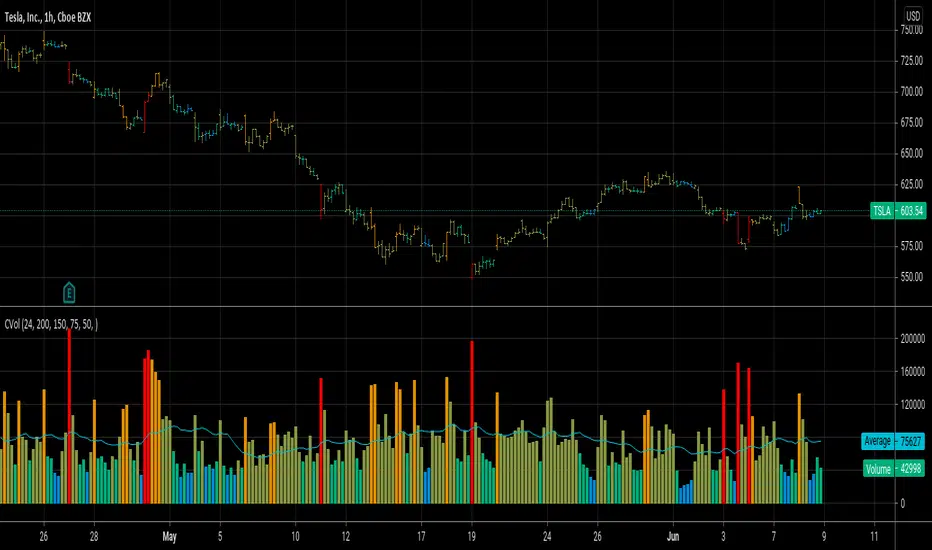
OPINICUS VOLUME DATA - Time Of Day Relative Volume (RVOL)This tool calculates the relative volume (RVOL) based on the normal average volume at that particular time of day.
Relative volume is a powerful piece of information because it offers a gauge as to whether a stock is in play or not. If RVOL is less than 1 it is not in play on this trading day or during this timeframe. If RVOL is above 2, it IS in play and can potentially be traded.
This script allows you to determine if relative volume is average, above average, 2x, or 3x via different color volume bars, at that particular time of day.
There are 2 different settings on this volume indicator.
The first setting is "Gradient." This is the preferred setting, and the one I personally use. Gradient is going to show you different color volume bars based on the RVOL multiple.
The color scheme is as follows:
Gray for average volume
Red if RVOL is between 1.0 and 1.5
Orange if RVOL is between 1.5 and 2
Green if RVOL is between 2.0 and 3.0
Lime green (bright green) if RVOL is greater than 3.
The second setting is "Price." This setting simply shows you the color of the candlestick. This is useful if you find the gradient setting to be too distracting, but still want to see if there is increased relative volume.
There is an alerts setting, which I find to be useful but can also be very distracting. If you leave the "Alert At RVOL %" setting at 0, then alerts will only be triggered if the current candle exceeds the 1.0 (100%) RVOL level. This happens far too frequently, so I prefer to put the alert at 2 or 3. If you change the "Alert At RVOL %" setting then alerts will be triggered if the RVOL percentage (blue number) exceeds your given value. The blue number is a percentage of the average, so if it’s at 1, then it’s 100% of the average.
Note: This tool does not work if you have after-hours or pre-market data displayed. The preferred setting for this tool is the 15' chart, with a 21 day look back period. It is also very useful on the daily chart when doing higher timeframe research.